Performance EstimationReal-time analysis and comparison between the energy produced by the plant and the estimation of the energy that should have been produced based on intelligent dynamically produced models. Deviations in performance are calculated with high accuracy (up to 2%) and facilitate the detection of potential disturbances the installation. Monitoring and Management
|
|
|
Rich Diagnostic Tools
Dynamic Alert & ReportingAlerts are sent through email and SMS in case of major failures and erratic operation. Full reporting regarding the plants' operational status and performance, as configured by the integrator. |
Product Comparison Matrix
 |
Other Systems | |
|---|---|---|
| Monitoring and management of multiple parks through a single interface. |  |
|
| Presentation and management of plants with inverters of multiple types / different manufacturers | |
Not supported by free systems |
| Compatibility with pre-installed telemetry systems (e.g SMA WebBox, Solar-Log, SolarMonitor 2) and environmental sensors. | |
– |
| Easy and fast installation. | |
 |
| Possibility of using one telemetry system for multiple parks. | |
– |
| Easy access via multiple devices (computers, tablets and smartphones). | |
|
| Visualization and analysis of plant data in real time. | |
Up to 3-hour delay |
| Automatic assessment of the performance of an installation through advanced Artificial Intelligence (AI) models. | |
– |
| Comparison of the deviation in the generated energy from the estimated one under real conditions. | |
– |
| Automatic calculation of the energy loss in case of breakdowns or malfunctions (e.g because of dust or shading). | |
– |
| Identification of multiple types of errors and centralized management. | |
|
| Sending of alerts through e-mail / SMS | |
|
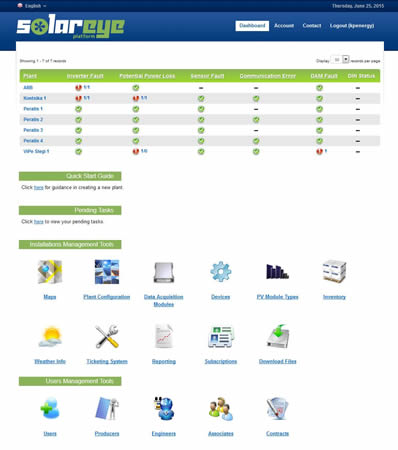
| Visualization of all installations in map with color-coding depending on their status. | |
|
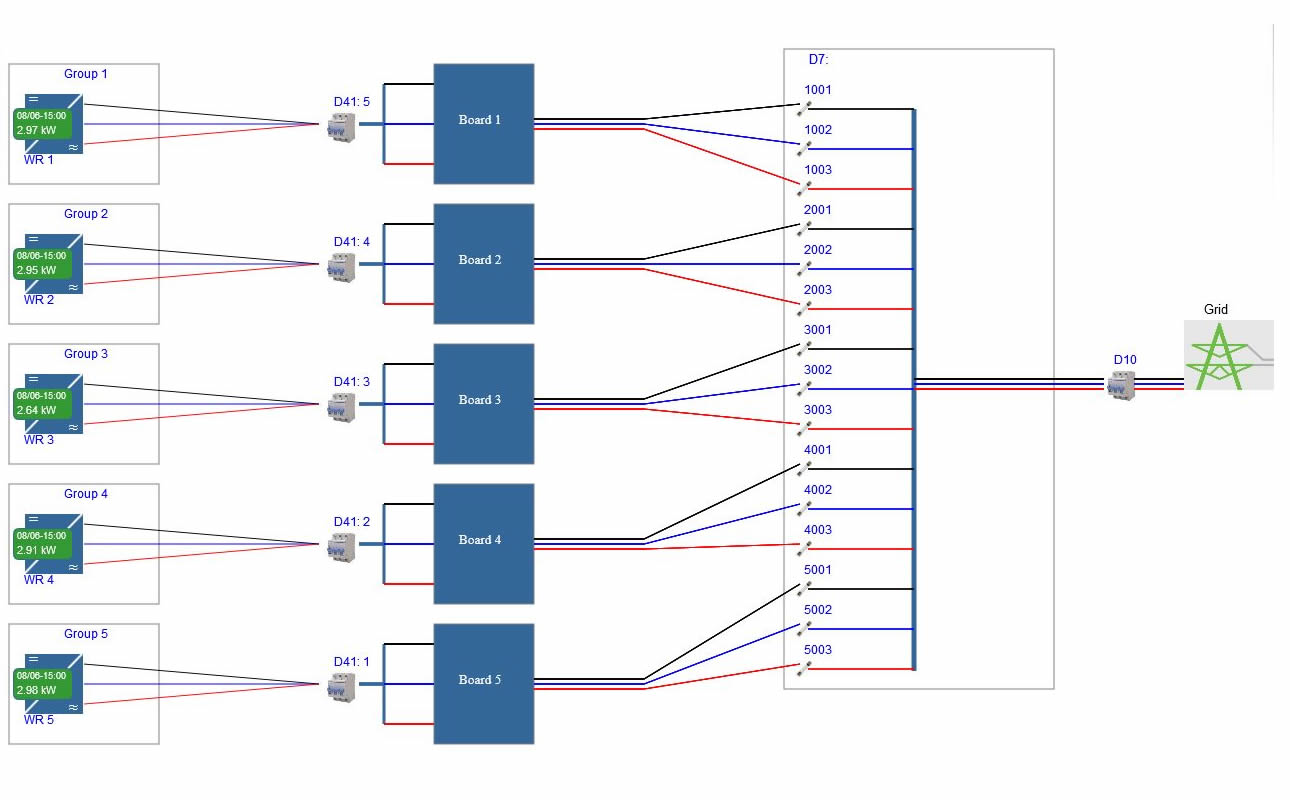
| Automatic generation of the AC diagram of each installation and visualization of possible faults | |
– |
| Graphical representation of multiple data (Generated Power, Energy, Current, Voltage, etc.). | |
|
| Multiple performance indicators for each installation (e.g Performance Ratio). | |
|
| Comparison of plants based on diffrent performance indicators. | |
|